by HPLC with Post-column Derivatization and Fluorescence Detection
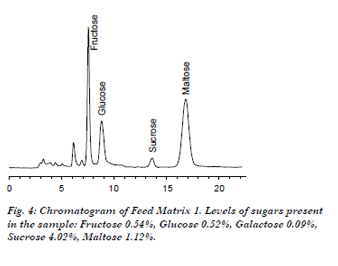
The types and amounts of sugar in animal feeds are as important as the amount of protein, minerals and fats in the determination of nutritive value. We developed a simple and sensitive HPLC method for analyzing six sugars in animal feeds – Sucrose, Fructose, Glucose, Galactose, Maltose and Lactose. Post-column derivatization reagents convert reducing and non-reducing sugars into fluorescent derivatives, which greatly improves the sensitivity and selectivity of the detection.
The blends of feed examined varied from grains/vegetable products (live stock feeds) to meat/vegetable products (pet food).
Method
Standards Preparation:
Mix 2.5 g of feed sample with 50 mL of water. Heat using a water bath while constantly mixing for 1 hour at 65 °C. Centrifuge and filter through 0.45 um filter.
Analytical Conditions
Column: Carbohydrate column, 4.6×150 mm
Temperature: 30 ºC
Flow Rate: 1 mL/min
Mobile Phase: Acetonitrile/Water
Injection Volume: 10 uL – 50 uL
Post-Column Conditions
Post-Column System: Pinnacle PCX or Vector PCX
Reactor Volume: 1.4 mL
Temperature: 130 °C
Reagent 1: Guanidine hydrochloride 60 mM in 200 mM Boric acid adjusted to pH 11.5 with KOH
Reagent 2: 1.5 mM periodic acid adjusted to pH 11.5 with KOH
Flow Rate: 0.15 mL/min each reagent
Detection: FLD; λex: 325 nm, λem: 465 nm
Calibration:
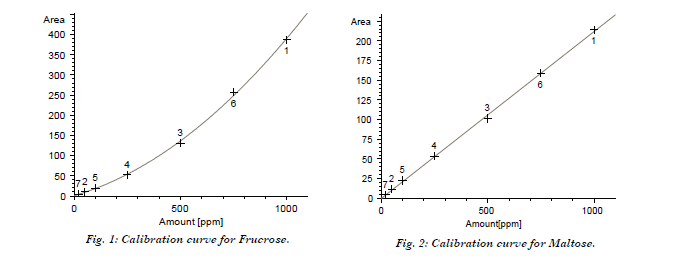
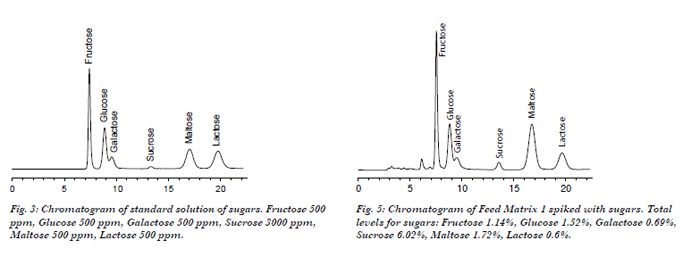
A quadratic calibration curve with correlation > 0.999 is observed for monosaccharides such as Fructose, Glucose and Galactose. A linear calibration curve with correlation > 0.999 is observed for disaccharides such as Maltose, Lactose and Sucrose. Examples of calibration curves presented in Fig. 1 and Fig. 2.
*Not Detected
You can download the method abstract 233 here: MA223 sugars in feeds |
|||||||||||||||||||||||||||||||||||||||||||||||||||||||||||||||||||||||||||||||||||||||||||||||||||||||||||||||||||||||||||||||||||||||||||||||||||||||||||||||||||||||||