Category Archives: post-column derivatization

Omelets and Pressure

By Saji George

There is a saying, “one cannot make an omelet without breaking a few eggs”. What do omelets and eggs have to do with post-column instrumentation? No direct correlation, but both have an underlying parameter that is important in achieving the final goal. Too much pressure on the egg and you will end up with egg shells in your omelet, too little pressure and there might not be an omelet.

In the case of the post-column derivatizer, there is a sweet spot (pressure range) that relates to a system that is working well. The system pressure is mostly comprised of the reagent pump(s) pressure(s) and gives an idea of how the overall system is performing. Too high and there is a constriction problem, too low and there is a leak in the flow path.

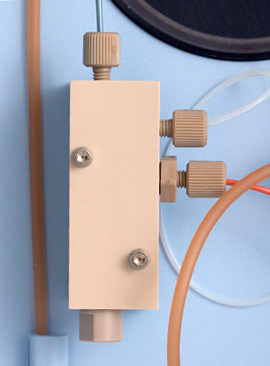
The pump pressure measures the pressure downstream from the pressure transducer. This includes the heated reactor, filters, unions, detector, and flow path tubing. All of these components have to be looked into when troubleshooting a high pressure problem. The best troubleshooting method is to remove one component at a time to look for the pressure drop; it is best to work backwards (start from the outlet of the detector). Components to pay attention to are: back pressure regulator, detector, ambient reactor, heated reactor, restrictors if there are any and last but not least the reagent filters. A significant drop (greater than 100 psi) in pressure when one of the components is removed would indicate that it is the source of the problem. The same thought process works for leaks also! Take a lint free towel and wipe all connections one by one, looking for areas of wetness that would indicate a leak.

Since summer is around the corner and graduations, admissions applications and final exams (to name a few) have been taken care of, please do take time to hit the sweet spot by enjoying the great outdoors!  

Replacing the Over-pressure Relief Valve Cartridge

Mixing-Manifold-1a 
Cleaning and Reassembly of the Over-pressure Relief Valve

  1. Remove the tubing connections to the Mixing Manifold. Use a 3/32” hex driver to remove the 2 screws holding the Mixing Manifold to the chassis. Use a 3/8” wrench to remove the end cap and discard the old Over-pressure Relief Valve Cartridge. Ultrasonicate the Mixing Manifold for at least 30 minutes. Rinse well with DI water.


  2. Connect the outlet of your HPLC pump to the Mixing Manifold inlet and pump 100% water at 0.5mL/min to verify the Mixing Manifold is not clogged. If the Mixing Manifold is still clogged after cleaning in an ultrasonicating bath, replace the Mixing Manifold Assembly (PN 1452-0040).
     
  3. Turn off the HPLC flow and make sure there is no pressure on the Mixing Manifold. Insert the new OPRV cartridge, green side down, and screw on the end cap to 20”lbs of torque. To approximate this level of torque, first finger tighten, then tighten an additional 1/8-1/4 turn with a 3/8” wrench.
     
  4. To verify the opening pressure of the Over-pressure Relief Valve, plug the two side inlets of the Mixing Manifold and turn on the HPLC pump to 0.5mL/min. Allow the pressure to slowly rise. The Over-pressure Relief Valve should open around 485psi. If the opening pressure is too low, tighten an additional 1/8 of a turn with a 3/8” wrench.

David Mazawa
david.mazawa@pickeringlabs.com
Technical Support Chemist
Pickering Laboratories, Inc.
1280 Space Park Way
Mountain View, CA 94043 USA
Phone: (650)694-6700 ext. 710
Fax: (650)968-0749


Simultaneous Analysis of B Vitamins in Protein Powders and Supplements

Our New Method Abstract, MA 239, describes the Simultaneous Analysis of Vitamins B1, B2, B3, and B6 using post-column derivatization.

B vitamins are a group of water soluble vitamins that play an important role in cell metabolism. This group consists of a number of compounds including Thiamine (Vitamin B1), Riboflavin (Vitamin B2), Niacin and Nicotinamide (Vitamin B3) and Pyridoxine and Pyridoxal (Vitamin B6). B vitamins are found in plant and animal food sources, such as legumes, nuts, green leafy vegetables, red meat and poultry. Many commercial food products are fortified with vitamin B complex and people could take multi-vitamins supplements to help fight vitamin B deficiencies.

Pickering Laboratories offers a method for simultaneous determination of Vitamins B1, B2, B3 and B6 in supplements and protein powders. The method uses chemical and photochemical post-column derivatization with Fluorescence detection that increases sensitivity and selectivity of analysis. Photochemical derivatization required for Niacin and Nicotinamide and chemical derivatization is needed for Thiamine. Vitamins B2 and B6 have natural fluorescence.Mixed B Vitamins Chromatograms

METHOD Overview. (to download the complete Method Abstract click HERE)
Instrument set up

Connect the instruments in the following order:
– Pinnacle PCX post-column derivatization instrument
– UVE™ photochemical reactor
– Fluorescence detector

Sample Preparation
For protein powders:
To 0.5 g of samples add 50 mL of extraction buffer (0.1 N NaOH adjusted to pH 2 with Phosphoric acid). Homogenize using hand held homogenizer for 30 sec and heat on a water bath at 100 ºC for 30 min. Cool the solution down, filter through 0.45 um nylon filter and inject. Protect from light.

For multi-vitamins supplements tablets:
Blend at least 10 tablets to a fine powder and mix the entire sample thoroughly. Weigh 250 mg of sample and add 90 mL of DI water acidified to pH 2.6 with 0.1 N HCl. Stir using magnetic stirring plate for 2 hours, protecting from light. Make the volume up to 100 mL with acidified water. Filter the sample through a 0.45 um nylon filter and inject. Protect from light.

Analytical Conditions
Analytical Column: Thermo Hypersil, Aquasil C18 (4.6×150 mm)
Column Temperature: 40 ºC
Flow Rate: 1 mL/min
Mobile Phase:
Solvent A: Potassium Phosphate Monobasic in DI water, adjusted with KOH, brought to 1L DI water.
Solvent B: Acetonitrile.

Post-column Conditions
Post-column Derivatization System: Pinnacle PCX and UVE Photochemical Reactor
Reactor Volume: 0.5 mL
Reactor Temperature: 30 ºC
Reagent: Sodium Hydroxide in DI water, with Sodium Sulfite
Detection: FLD


Analysis of Sugars in Feeds

by HPLC with Post-column Derivatization and Fluorescence Detection

The types and amounts of sugar in animal feeds are as important as the amount of protein, minerals and fats in the determination of nutritive value. We developed a simple and sensitive HPLC method for analyzing six sugars in animal feeds – Sucrose, Fructose, Glucose, Galactose, Maltose and Lactose. Post-column derivatization reagents convert reducing and non-reducing sugars into fluorescent derivatives, which greatly improves the sensitivity and selectivity of the detection.

The blends of feed examined varied from grains/vegetable products (live stock feeds) to meat/vegetable products (pet food).

Method

Standards Preparation:

Mix 2.5 g of feed sample with 50 mL of water. Heat using a water bath while constantly mixing for 1 hour at 65 °C. Centrifuge and filter through 0.45 um filter.

Analytical Conditions
Column: Carbohydrate column, 4.6×150 mm
Temperature: 30 ºC
Flow Rate: 1 mL/min
Mobile Phase: Acetonitrile/Water
Injection Volume: 10 uL – 50 uL

Post-Column Conditions
Post-Column System: Pinnacle PCX or Vector PCX
Reactor Volume: 1.4 mL
Temperature: 130 °C
Reagent 1: Guanidine hydrochloride 60 mM in 200 mM Boric acid adjusted to pH 11.5 with KOH
Reagent 2: 1.5 mM periodic acid adjusted to pH 11.5 with KOH
Flow Rate: 0.15 mL/min each reagent

Detection: FLD; λex: 325 nm, λem: 465 nm

HPLC GRADIENT
TIME (Min) WATER, % ACN, %
0.0 20 80
20.0  20  80
20.1  50  50
30.0  50  50
30.1  20  80

Calibration:

A quadratic calibration curve with correlation > 0.999 is observed for monosaccharides such as Fructose, Glucose and Galactose. A linear calibration curve with correlation > 0.999 is observed for disaccharides such as Maltose, Lactose and Sucrose. Examples of calibration curves presented in Fig. 1 and Fig. 2.M_237a

 
  FRUCTOSE GLUCOSE GALACTOSE SUCROSE MALTOSE LACTOSE
FEED MATRIX 1
Content in feed, %  0.54 0.52 0.09 4.02 1.12 ND*
Spike Concentration, %  0.60 0.58 0.60 2.02 0.58 0.59
Recoveries, n=3, % 105 107 110 91 103 114
Spike Concentration, % 1.21 1.20 1.19 4.05 1.22 1.21
Recoveries, n=3, % 108 106 110 85 85 103
FEED MATRIX 2
Content in feed, % 0.23 0.46 ND* 3.21 0.59 ND*
Spike Concentration, % 0.42 0.57 0.56 2.50 0.57 0.58
Recoveries, n=3, % 98 101 104 106 106 107
Spike Concentration, %  0.81 1.14 1.12 4.80 1.11 1.15
Recoveries, n=3, % 103 101 101 102 102 106
FEED MATRIX 3
Content in feed, %  0.14 0.11 ND* 0.51 0.02 ND*
Spike Concentration, % 0.38 0.56 0.57 2.40 0.55 0.56
Recoveries, n=3, % 95 101 116 102 95 101
FEED MATRIX 4
Content in feed, %  0.17 0.13 ND* 1.35 0.21 ND*
Spike Concentration, % 0.41 0.57 0.58 2.43 0.56 0.56
Recoveries, n=3, % 92 97 116 101 95 102
 

*Not Detected

M_223b

M_223c

You can download the method abstract 233 here: MA223 sugars in feeds


Amino Acid Analysis of Monoclonal Antibodies

Method Abstract 373, Amino Acid Analysis of Monoclonal Antibodies

The peptide and protein based pharmaceuticals are a rapidly expanding class of therapeutical agents that are used to treat a wide variety of health conditions, including cancer, metabolic and auto-immune diseases, HIV and more. Biologic drugs, such as monoclonal antibodies, are derived from living organisms and are usually very expensive. As many biologics are coming off of patents, the market is ready for cost-saving biogenerics. But all proteins, including monoclonal antibodies, have complex structures that determine their function. Differences in structure would alter biological activity leading to changes in safety and efficacy of the drug.

ICH Q6B is a guidance document that provides a set of internationally accepted specifications for biotechnological and biological products to support new marketing applications. It establishes the set of criteria to which a drug substance, drug product or material should conform to be considered acceptable for intended use.

aaa chromatograms from MA373Determining Amino Acid composition following hydrolysis is listed in ICH Q6B as a way to characterize the protein and to confirm its identity by comparing with Amino Acid composition deduced from the gene sequence of the desired product. Amino Acid Analysis data is also used to accurately determine the protein content.

The Amino Acids Analysis with post-column derivatization is a very sensitive, reproducible and rugged method and it has been a preferred approach for laboratories running biological samples, protein, peptides and foods analysis. Pickering Laboratories Inc. offers many Amino Acids Analysis products including post-column derivatization instruments, columns, eluants, reagents and standards. All products are designed to work together to deliver optimum results for any chosen sample.

METHOD
Analytical conditions
Column: High-efficiency Sodium cation-exchange column, 4.6 x 110 mm, P/N 1154110T
Flow Rate: 0.6 mL/min
Mobile Phase: See method in Table 1

Post-Column Conditionsgradient table for AAA monoclonal AB
Post-column System: Pinnacle PCX
Reactor Volume: 0.5 mL
Reactor Temperature: 130 °C
Flow Rate: 0.3 mL/min
Detection: UV/VIS 570 nm for primary amino acids, 440 nm for secondary amino acids
Injection Volume: 10-50 uL

You can download this abstract, as well as our product catalog and other notes from our website: www.pickeringlabs.com


Calculation of Whey Protein Fraction in Milk-Based Infant Formula

A method for the calculation of whey protein fraction in milk-based formula products was developed and validated by a group of researchers from Abbott Nutrition, Covance Laboratories and AOAC International. The method is based on calculating the ratio of (Asx + Ala)/(Pro+Phe) determined from the amino acid profile of the hydrolyzed sample.

The method was approved as AOAC Official First Action Method 2012.07 and is appropriate for accessing compliance with whey content requirements of GB 10765-2010 (National Food Safety Standard Infant Formula)*. It is applicable to finished products containing both intact and partially hydrolyzed whey proteins.

According to this method, the Amino Acid Profile of hydrolyzed samples is determined using cation-exchange chromatography with post-column derivatization and UV/Vis detection. The researchers used Pickering Laboratories post-column derivatization system, our patented Trione Ninhydrin reagent and Pickering Sodium analytical column and buffers.

The method performance was evaluated using non-fat dry milk and products with whey levels from 32% to 63%, including NIST Infant Formula Standard Reference Material. The repeatability ranged between 0.3 and 2.5 %, while intermediate precision were between 2.6 and 3.4%. Average recoveries ranged from 97 to 100%.

The unmatched accuracy and precision of amino acid analysis by HPLC with post-column derivatization allowed the researches to develop a robust mathematical model for calculating whey protein fraction that can be successfully applied to a wide range of products. This proved once again that post-column derivatization analysis of amino acids is still a method of choice for laboratories that require highly accurate results.

Pickering Laboratories offers a total solution for amino acids analysis, including post-column derivatization systems, reagents, columns, buffers and standards.

The reference to the published study is below. The First Action Official Method 2012.07 can also be found online at http://www.eoma.aoac.org/.

Calculation of Whey Protein Fraction in Milk-Based Infant Formula: First Action 2012.07

Authors: Wesley Jacobs, Paul Johns, Phillip Haselberger, Joseph J. Thompson, Darryl Sullivan, Steve Baugh.

Source: Journal of AOAC International, Volume 96, No. 3, 2013, pp. 502-507


(*) this is a Chinese Standard

Amino Acid Analysis of Cell Culture Media

We have a new Method Abstract! MA371, Amino Acid Analysis of Cell Culture Media

Cell cultures are widely used to produce biopharmaceuticals and other biologically active compounds. The composition of the cell culture media affects the yield and structure of the desired products and must be carefully optimized. Cell culture media is typically composed of mixtures of amino acids, vitamins, carbohydrates, inorganic salts as well as different peptides, proteins and other compounds. As the cells grow, they consume nutrients and release target biopharmaceuticals as well as waste products.

Amino Acids serve as the building blocks of proteins, as well as intermediates in many metabolic pathways. Amino Acids are typically added to cell culture media to provide nutritional requirements for the cells. Monitoring and adjusting Amino Acid composition is an essential part of optimizing the manufacturing process to ensure high quality and optimum yield of the final product.

Amino Acid Analysis using cation-exchange chromatography with post-column Ninhydrin derivatization allows for easy determination of Amino Acid concentrations in many complex matrices, including cell culture media. The post-column method is very sensitive, reproducible and rugged. It has been and continues to be a method of choice for laboratories running biological samples, protein, peptides and foods analysis. Most chemical compounds present in the media do not interfere with analysis, so the majority of samples only need diluting with citric buffer and filtering before analysis. If serum is added to the media, then the proteins need to be precipitated using either Seraprep™ solution or ultrafiltration.

Pickering Laboratories, Inc. offers the complete solution for Amino Acid Analysis, including post-column derivatization instruments, columns, eluants, reagents and standards. The Pinnacle PCX derivatization system has a programmable column oven to allow for shorter run times and easy method optimization.

YChromatograms of Cell Culture Mediaou can download this application note, and many others from our website: www.pickeringlabs.com

METHOD
Analytical conditions
Column: High-efficiency Lithium cation-exchange column, 4.6 x 75 mm, Catalog Number 0354675T
Flow Rate: 0.55 mL/min
Mobile Phase: See method in Table 1

Post-Column Conditions
Post-column System: Pinnacle PCX
Reactor Volume: 0.5 mL
Reactor Temperature: 130 °C
Flow Rate: 0.3 mL/min
Detection: UV/VIS 570 nm for primary amino acids, 440 nm for secondary amino acids
Injection Volume: 10-50 uL

gradient table for AAA